DOI: http://dx.doi.org/10.20986/revesppod.2024.1698/2024
RESEARCHER’S CORNER
Sensitivity, specificity, and predictive values (Part II)
Sensibilidad, especificidad y valores predictivos (Parte II)
Javier Pascual Huerta1
1Clínica del Pie Elcano. Bilbao, España
Correspondence: Javier Pascual Huerta
javier.pascual@hotmail.com
Received: 20-11-2023
Accepted: 05-12-2023
In the previous issue of this section of the Researcher’s Corner, we introduced the terms of sensitivity, specificity, and predictive values in dichotomous diagnostic tests used in health. When studies refer to these concepts to describe the characteristics of a test, the simplicity and familiarity with which these metrics are used mask the existence of a number of complexities that are usually not considered. In this section, we will discuss two ideas in the interpretation of these concepts: the interpretation and confusion generated by sensitivity and specificity, and how the prevalence of the disease affects the positive and negative predictive value of a test.
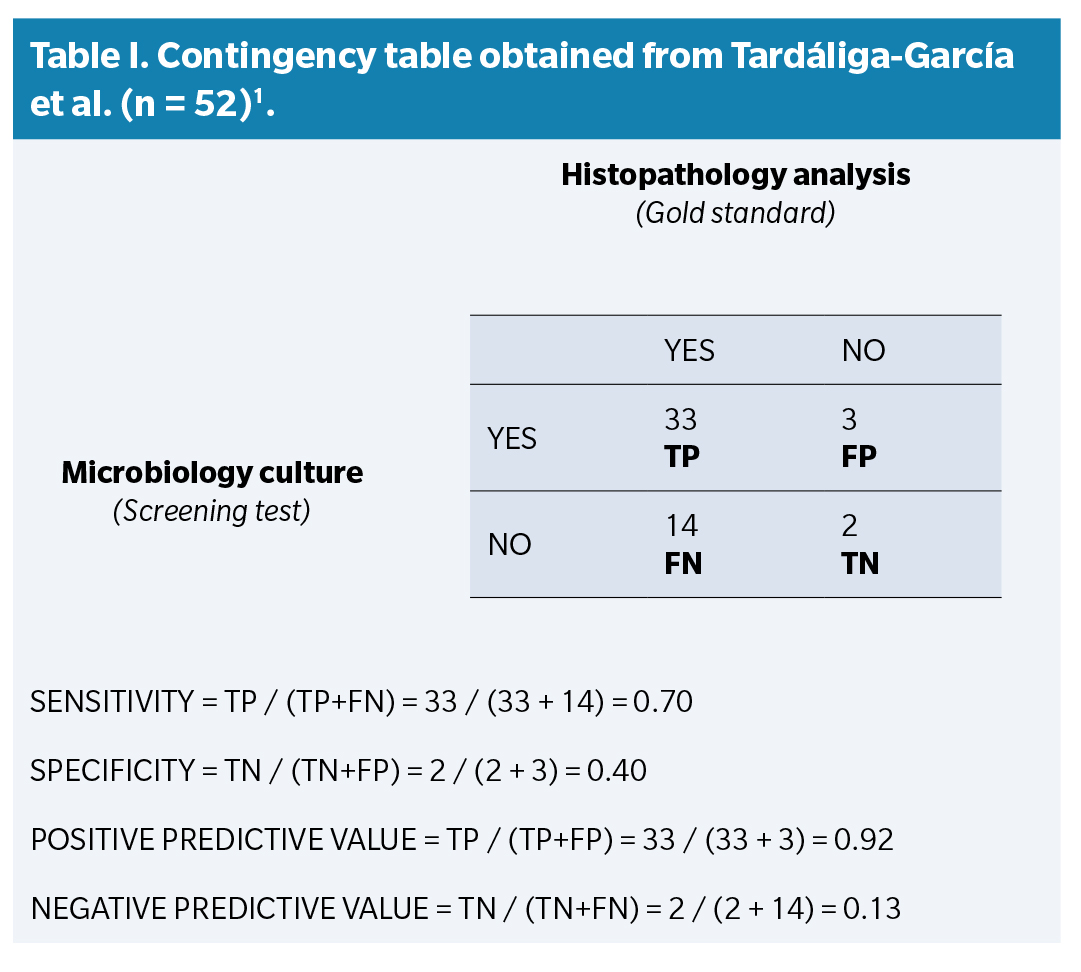
Sensitivity measures the proportion of people with the disease who have a positive result with the study or screening test (sensitivity = TP / (TP + FN) × 100) (Table 1. The sensitivity value cannot provide a definitive recommendation in making a decision for a specific patient, even if the test result is positive, because the test has false positives that are not considered in the calculation of sensitivity. In fact, false positives are ignored when calculating sensitivity (only the TP and FN cells are used to calculate sensitivity). A positive result, by itself, even when the test has high sensitivity, is not really useful for making a decision on whether a disease is present in a specific patient. Similarly, specificity measures the proportion of people without the disease who have a negative result from the study test (specificity = TN / (TN + FP) × 100). The specificity of a test does not provide an adequate indication for a patient with a negative test result because negative test results can contain false negatives that are ignored when determining the specificity of the test (only the TN and FP cells are used to calculate specificity). A negative result in a highly specific test is by no means definitive for ruling out a disease in a particular individual. These ideas reflect the common error of believing that a positive result in a highly sensitive test indicates the presence of a disease or condition, and that a negative result in a highly specific test indicates the absence of the disease or condition.

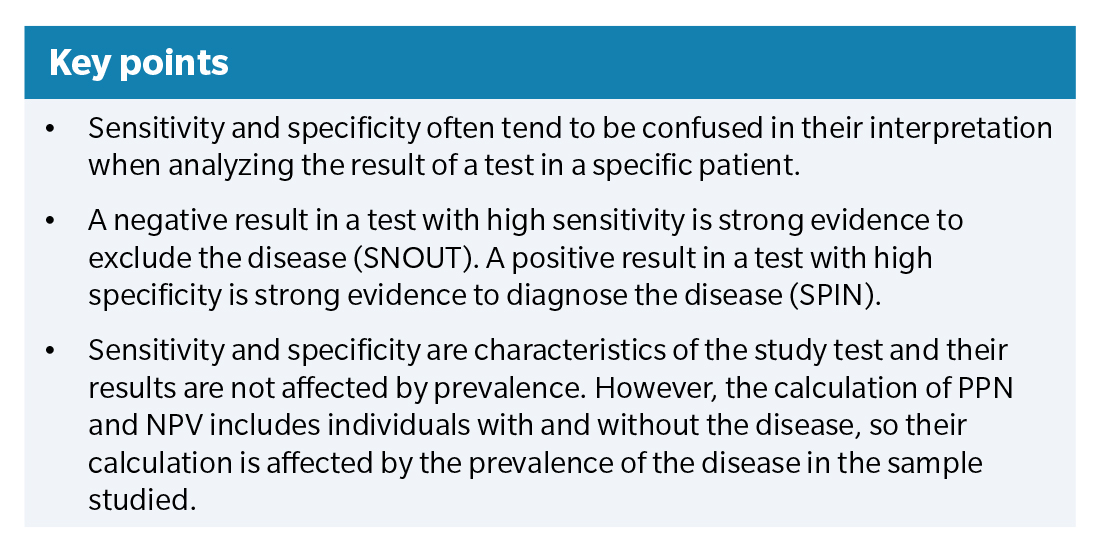
Despite this, both concepts of sensitivity and specificity can be very useful if the values are high. There is an inverse relationship between true positives and false negatives such that a test with very high sensitivity indicates a test with many true positives and very few false negatives. This is why, in a test with high sensitivity, if it gives a negative result, it is very rare that the patient has the disease or condition. In other words, when a test with high sensitivity gives a negative result, it allows one to rule out with a considerable degree of certainty that the individual has the disease. This has led to the mnemonic rule SNOUT (Sensitivity, Negative, OUT-; note that the N in SNOUT refers to both sensibility and negative). Similarly, in the case of specificity, there is an inverse relationship between true negatives and false positives such that a test with very high specificity indicates a test with many true negatives and very few false positives. Individuals who have tested positive in a highly specific test are very likely to have the disease or condition. In other words, when a test with high specificity gives a positive result, it allows one to ensure with a significant degree of confidence that the individual has the disease. This idea has led to the mnemonic rule SPIN (Specificity, Positive, IN-; note that the P in SPIN refers to both specificity and positive).
These mnemonics, SNOUT & SPIN, are a counterintuitive application of the concepts of sensitivity and specificity that only work when both values are high. A screening test with high sensitivity is not necessarily useful for finding patients. In fact, it is especially useful when the test result is negative because it provides strong evidence indicating the absence of disease. Similarly, a test with very high specificity is not useful for ruling out a disease when it is not present. In fact, it is especially useful when the result is positive for deciding that the patient most likely has the disease.
The second idea of this letter refers to how positive predictive values (PPV) and negative predictive values (NPV) are conditioned by the prevalence of the disease in the sample studied. Sensitivity is calculated using only the cases with disease, and specificity using only the cases without disease according to the reference test. Both are characteristics of the study test, and prevalence does not affect their results. However, the calculation of PPV and NPV includes individuals with and without the disease, so their calculation is affected by the prevalence of the disease in the sample. Tardáguila-García et al. conducted a study in 2021 to compare the diagnostic accuracy of microbiological culture (screening test) with histopathological analysis (Gold standard) in diabetic patients with suspected osteomyelitis. Table 1 presents a 2 × 2 table showing the results obtained by the authors. Each case is assigned to one of the four boxes of the table according to its result in the microbiological culture (positive or negative) and its result in the histopathological analysis (positive or negative):
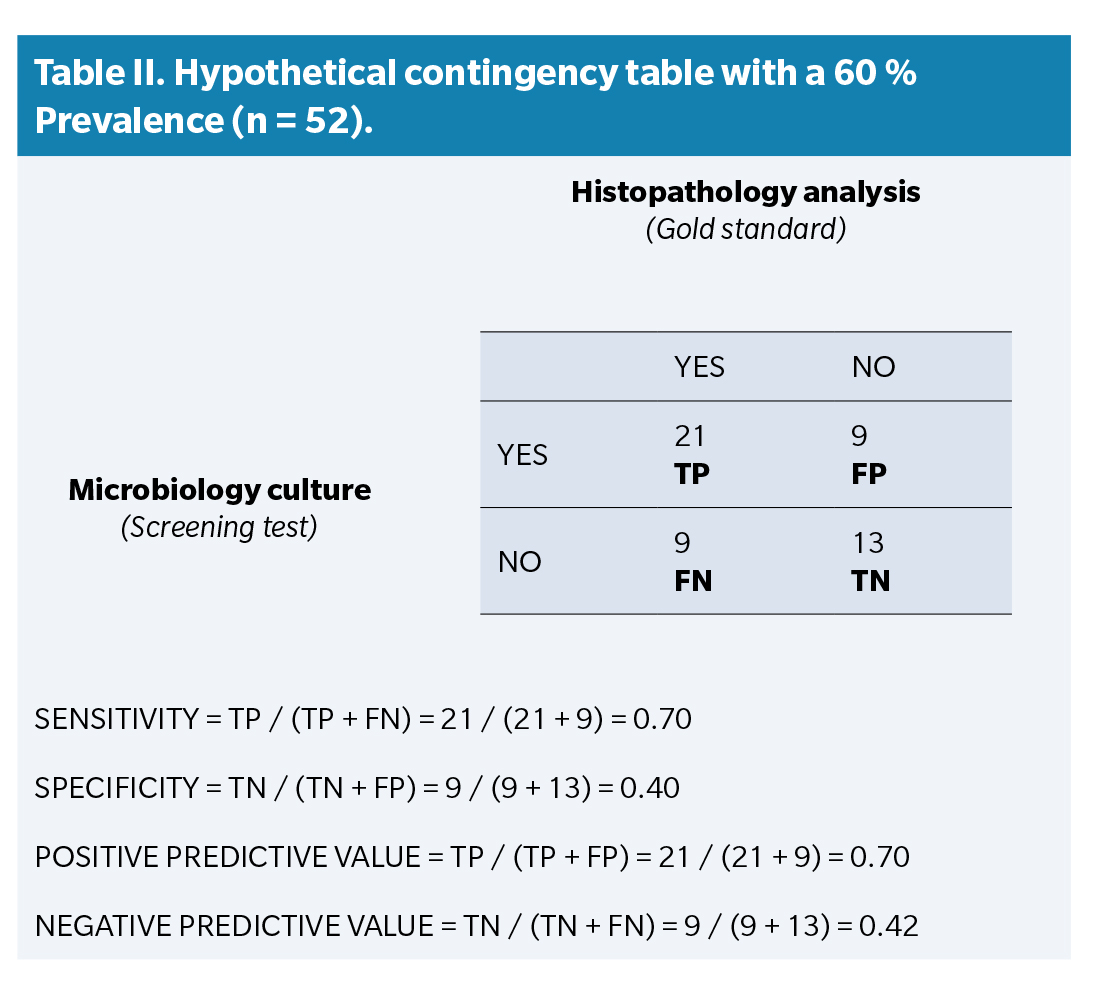
The prevalence of the disease in this sample used by the authors is very high. According to the reference test (histopathological analysis), 47 of the 52 cases had osteomyelitis in the analyzed sample (90.4 % prevalence). Now let’s imagine that the results had been obtained with a sample in which the prevalence of the disease was lower, for example around 60%, and calculate the statistics based on this new hypothetical prevalence. Table 2 shows hypothetical results of the Tardáguila-García et al. study in which the cases have been modified to decrease the disease prevalence to 31 cases with osteomyelitis (59.6 % prevalence) while maintaining the sensitivity (0.70) and specificity (0.40) values of the study.
In Table 2, PPV and NPV change significantly compared to the authors’ original study. PPV drops from 0.92 down to 0.70, while NPV goes up from 0.13 up to 0.42. For a clinician, the important point of studies evaluating the efficacy of diagnostic tests is whether patients who have tested positive (or negative) can be diagnosed with the disease. In the original study, 92 % of patients with a positive culture had osteomyelitis. In the hypothetical example, this percentage was only 70 %. Of those who had a negative test in the original study, only 13 % did not have the disease (87 % had osteomyelitis despite having a negative result), while in the invented example, this percentage was 42 %. These data illustrate the fact that the ability of a test to make a specific diagnosis based on its results depends on the discriminatory value of the test and the prevalence of the disease in the sample studied. If the disease prevalence is very high in the sample (more than in the normal population), the PPV tends to be overestimated, and the NPV tends to be underestimated, and vice versa in the opposite case.

As a final point, in studies of the efficacy of diagnostic tests, the test to be studied is compared with what is thought to be the definitive indicator, commonly referred to as the gold standard. The words “gold standard” suggest that this test provides presumably indisputable evidence of whether the disease exists or not. However, there may be doubts about the validity of the so-called gold standards, actually in the case of histopathological study in the diagnosis of OM, there are some(2). This is why these tests have begun to be referred to less enthusiastically as “reference standards”. In this and the previous letter, we have used the term gold standard, although the correct denomination for the reasons stated is currently “reference standard”.

References
- Tardáliga-García A, Sanz-Corbalán I, García-Morales E, García-Álvarez Y, Molines-Barroso RJ, Lázaro-Martínez JL. Diagnostic Accuracy of Bone Culture Versus Biopsy in Diabetic Foot Osteomyelitis. Adv Skin Wound Care. 2021;34(4):204-8. DOI: 10.1097/01.ASW.0000734376.32571.20.
- Meyr AJ, Singh S, Zhang X, Khilko N, Mukherjee A, Sheridan MJ, Khurana JS. Statistical reliability of bone biopsy for the diagnosis of diabetic foot osteomyelitis. J Foot Ankle Surg. 2011;50(6):663-7. DOI: 10.1053/j.jfas.2011.08.005.
Recommended references
Carvajal DN, Rowe PC. Sensitivity, specificity, predictive values, and likelihood ratios. Pediatr Rev. 2010;31(12):511-3.
Ghaalip Lalkhen A, McCluskey A. Clinical test: sensitivity and specificity. Continuing Education in Anaesthesia. Critical Care & Pain. 2008;8(6). DOI: 10.1093/bjaceaccp/mkn041. DOI: 10.1093/bjaceaccp/mkn041.
Trevethan R. Sensitivity, Specificity, and Predictive Values: Foundations, Pliabilities, and Pitfalls in Research and Practice. Front Public Health. 2017;5:307. DOI: 10.3389/fpubh.2017.00307.